NAR: More Than 85% of Metro Areas Posted Home Price Gains in the Fourth Quarter of 2023
WASHINGTON—More than 85% of metro markets (189 out of 221) registered home price increases in the fourth quarter of 2023 as the 30-year fixed mortgage rate dropped from 7.79% to 6.61%, according to the National Association of Realtors’ latest quarterly report. A total of 15% of the 221 tracked metro areas experienced double-digit price gains over the same period, up from 11% in the third quarter.
“Homeowners have benefited from housing wealth accumulation. However, many homebuyers have been shocked at high housing costs, with a typical monthly mortgage payment rising from $1,000 three years ago to more than $2,000 last year,” said NAR Chief Economist Lawrence Yun. “This doubling in housing costs for recent home buyers is not included in the official consumer price index inflation calculations and contributes to the sense of dissatisfaction about the economy.”
Compared to one year ago, the national median single-family existing-home price grew 3.5% to $391,700. In the prior quarter, the year-over-year national median price increased 2.2%.
Among the major U.S. regions, the South posted the largest share of single-family existing-home sales (45%) in the fourth quarter, with year-over-year price appreciation of 3.2%. Prices also climbed 7.3% in the Northeast, 4.7% in the Midwest and 4.2% in the West.
“Sales were restrained due to limited inventory,” Yun said. “But increased homebuilding, along with lower mortgage rates, will not only improve housing affordability but also help bring more homes onto the market in 2024.”
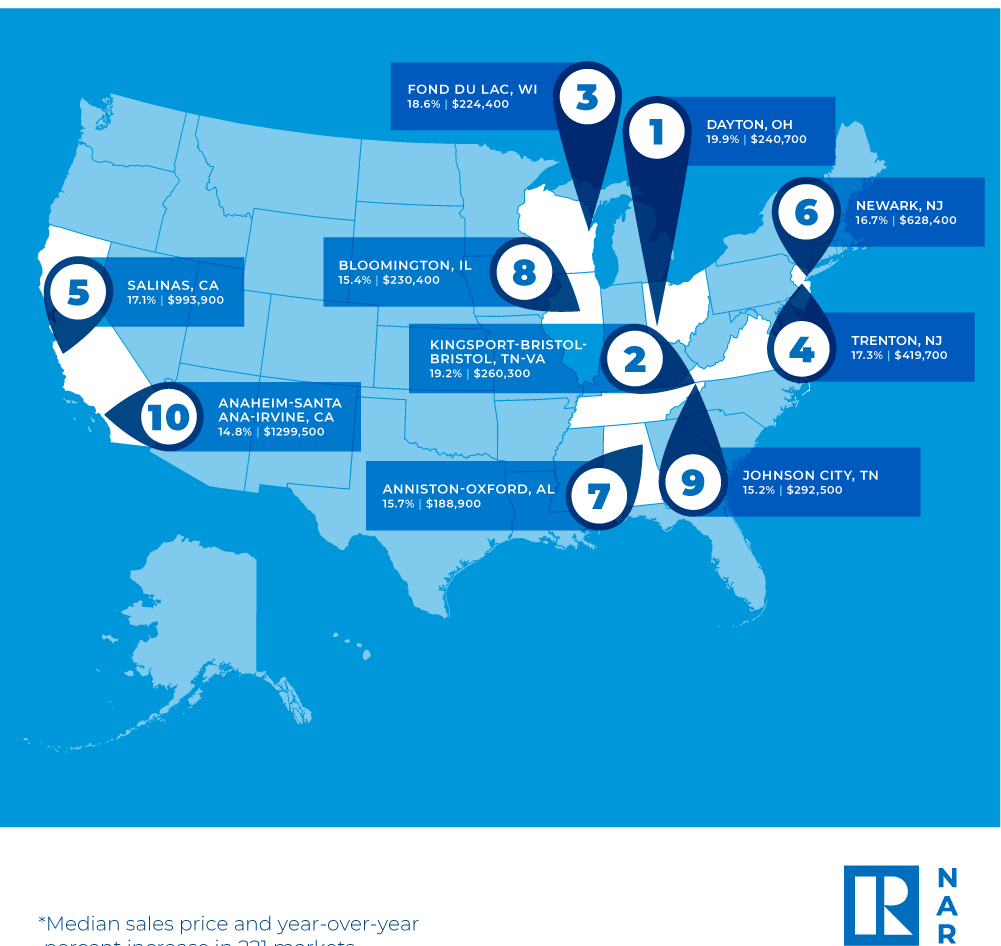
The top 10 metro areas with the largest year-over-year median price increases, which can be influenced by the types of homes sold during the quarter, all recorded gains of at least 14.8%. Those include Dayton, OH (19.9%); Kingsport-Bristol-Bristol, TN-VA (19.2%); Fond du Lac, WI (18.6%); Trenton, NJ (17.3%); Salinas, CA (17.1%); Newark, NJ-PA (16.7%); Anniston-Oxford, AL (15.7%); Bloomington, IL (15.4%); Johnson City, TN (15.2%); and Anaheim-Santa Ana-Irvine, CA (14.8%).
Eight of the top 10 most expensive markets in the U.S. were in California. Overall, those markets are San Jose-Sunnyvale-Santa Clara, CA ($1,750,300; 11%); Anaheim-Santa Ana-Irvine, CA ($1,299,500; 14.8%); San Francisco-Oakland-Hayward, CA ($1,251,000; 4.3%); Urban Honolulu, HI ($1,069,400; -1.9%); Salinas, CA ($993,900; 17.1%); San Diego-Carlsbad, CA ($931,600; 8.7%); Oxnard-Thousand Oaks-Ventura, CA ($916,800; 7.9%); San Luis Obispo-Paso Robles, CA ($912,100; 5.7%); Los Angeles-Long Beach-Glendale, CA ($884,400; 6.7%); and Boulder, CO ($849,400; 11.8%).
Less than one-fifth of markets (14%; 32 of 221) experienced home price declines in the fourth quarter, down from 17% in the third quarter.
Housing affordability marginally improved in the fourth quarter on the back of declining mortgage rates. The monthly mortgage payment on a typical existing single-family home with a 20% down payment was $2,163, down 1.2% from the third quarter ($2,189) but up 10%—or $196 – from one year ago. Families typically spent 26.1% of their income on mortgage payments, down from 26.7% in the previous quarter but up from 24.2% one year ago.
Lack of inventory and affordability continued to impact first-time buyers during the fourth quarter. For a typical starter home valued at $332,900 with a 10% down payment loan, the monthly mortgage payment fell slightly to $2,120, down 1.2% from the prior quarter ($2,146). However, that was an increase of $190, or 9.8%, from one year ago ($1,930). First-time buyers typically spent 39.4% of their family income on mortgage payments, down from 40.3% in the prior quarter.
A family needed a qualifying income of at least $100,000 to afford a 10% down payment mortgage in 47.1% of markets, up from 45.7% in the previous quarter. Yet, a family needed a qualifying income of less than $50,000 to afford a home in 2.3% of markets, down from 2.7% in the prior quarter.