NAR: Northeast Pending Home Sales Fell 5.7% in January
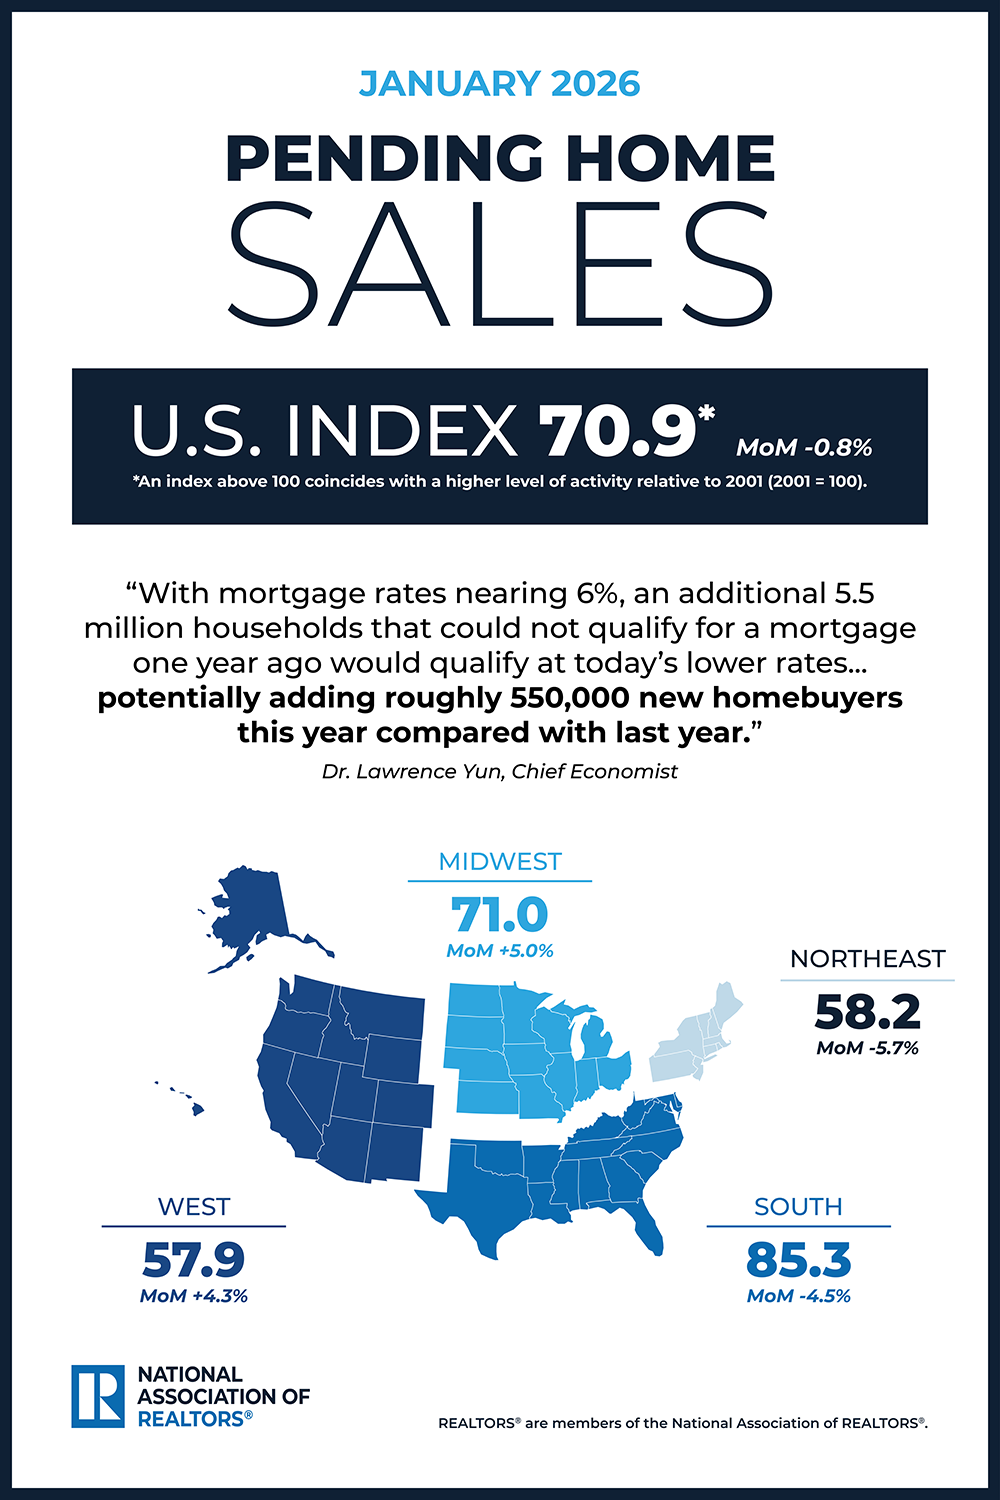
WASHINGTON—U.S. pending home sales in January decreased by 0.8% from the prior month and 0.4% year-over-year, according to the National Association of Realtors Pending Home Sales Report released today.
Month-over-month pending home sales rose in the Midwest and West, and declined in the Northeast and South. Year-over-year pending home sales rose in the South and West and declined in the Northeast and Midwest.
“Improving affordability conditions have yet to induce more buying activity,” said NAR Chief Economist Dr. Lawrence Yun. “With mortgage rates nearing 6%, an additional 5.5 million households that could not qualify for a mortgage one year ago would qualify at today’s lower rates. Most newly qualifying households do not act immediately, but based on past experience, about 10% could enter the market—potentially adding roughly 550,000 new homebuyers this year compared with last year.”
“Unless housing supply increases, these additional potential buyers becoming active in the market could simply push up home prices. This will put increasing pressure on affordability, which is why it is critical to increase supply by building more homes. Fortunately, the House of Representatives recently passed the Housing for the 21st Century Act with strong bipartisan support, an important signal that addressing the nation’s housing shortage remains a shared priority. The legislation is a meaningful step toward expanding housing supply and removing barriers that make it harder for Americans to achieve homeownership,” Yun added.
While national pending home sales fell slightly in January, several local markets are showing notable year-over-year gains. Among the 50 largest metro areas, the following 10 markets posted the biggest annual increases in pending home sales, according to data from Realtor.com Economics:
Phoenix–Mesa–Chandler, AZ (+11.8%)
Boston–Cambridge–Newton, MA-NH (+10.7%)
Charlotte–Concord–Gastonia, NC-SC (+10.7%)
San Francisco–Oakland–Fremont, CA (+8.9%)
Oklahoma City, OK (+8.7%)
St. Louis, MO-IL (+8.0%)
Virginia Beach–Chesapeake–Norfolk, VA-NC (+7.6%)
San Diego–Chula Vista–Carlsbad, CA (+7.5%)
San Antonio–New Braunfels, TX (+7.4)
Miami–Fort Lauderdale–West Palm Beach, FL (+6.8%)
January 2026 National Pending Home Sales
0.8% decrease month over month
0.4% decrease year over year
January 2026 Regional Pending Home Sales
Northeast
5.7% decrease month over month
8.3% decrease year over year
Midwest
5.0% increase month over month
3.3% decrease year over year
South
4.5% decrease month over month
4.0% increase year over year
West
4.3% increase month over month
0.3% increase year over year